A Condensed Version of The U.S. Pay Transparency Index 2025
Learn more about the following beqom products

Executive summary
Over the last decade, the United States has made strides in addressing pay inequities across the board with a slate of pay transparency laws. These laws, which require employers to disclose salaries or salary ranges for positions, exist to ensure that employees are paid based on their experience and skills, rather than characteristics beyond their control, such as race, gender, disability, or similar factors. Yet our report shows that pay transparency has a long way to go to deliver on its promises.
To understand how well pay transparency laws are implemented, we examined job listings in 12 jurisdictions: eight with full pay transparency, two with partial transparency, and two with no mandatory transparency.
Our research found:
- Less than half of the 13,303 job postings met our criteria for full compliance with rigorous pay transparency requirements.
- In jurisdictions with full mandatory transparency, only about 50% of listings met our full compliance criteria. An additional 25% of listings were partially compliant.
- Listings for well-paid, white-collar work were more compliant with pay transparency laws than postings for lower-wage, blue-collar opportunities within the same jurisdiction. Workers who need pay transparency laws the most are being left behind.
Overall, compliance needs to be stronger, legislation needs to be standardized, and better protections for lower-wage workers need to be enacted. Without these changes, pay transparency will continue to be an issue — one that exacerbates pay inequalities and wage gaps, and leads to employees who feel resentful and disengaged rather than energized and motivated to give their best.

For more insights and a deeper understanding of the methodology we used, read our full report.
An overview of pay transparency in the U.S.
In less than 10 years, the U.S. went from no pay transparency laws to more than 60 million workers being covered. As of the writing of this report, 12 states, as well as six cities and counties, have had some form of pay transparency laws take effect. A further 12 have laws winding through their state legislatures or set to take effect later this year.
Why care about pay transparency? Because it's important. Pay transparency means more engaged workers, higher productivity, and fewer wage gaps.
Massive expansion of workers' rights rarely happens fast, and these laws move the needle in a positive direction. But more than half of states remain without coverage, and even in covered jurisdictions, major gaps leave employees vulnerable.
Problems with the current state of pay transparency laws include:
- Many laws are enacted at the state or city level and apply only to employees who live or work in those jurisdictions. Without a unified framework, companies face confusion over whether to follow laws made by the state where the company is based, the state where the employee resides, or the state where remote workers could perform the job.
- Mandates are often vague, requiring "reasonable pay ranges" without defining what that means. Standards for "pay transparency" also differ: some laws require salary disclosure in job postings, others only at the offer stage, and some only upon request from existing employees.
- Enforcement relies on job seekers to report violations; however, unclear rights and reporting avenues deter complaints. Therefore, low enforcement priority leaves many employees unprotected.
U.S. pay transparency in numbers
Accurate as of May 2025
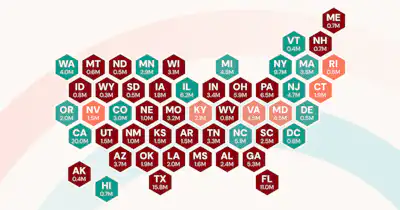
# of states with some level of transparency: 14, plus the District of Columbia
- Strict: 12, plus D.C. (26%)
- Loose: 2 (4%)
- None: 36 (71%)
# of states with salary history protections: 14, plus DC
- Strict: 13, plus D.C. (27%)
- Loose: 1 (2%)
- None: 37 (73%)
Approximate # of workers covered by transparency legislation: 60 million (40%)
- Strict: 56.8 million (36%)
- Loose: 3.2 million (2%)
- None: 98 million (62%)
# of workers estimated to be covered by the end of 2025: 73 million (46%)
State | Transparency | Salary Discussion Protections | Salary History Ban | Geographic Applicability | Estimated Workers Covered |
|---|---|---|---|---|---|
California | Strict Transparency | Strict Protections | Strict Ban | Full Jurisdiction | 17,976,000 |
Colorado | Strict Transparency | Strict Protections | Strict Ban | Full Jurisdiction | 2,976,000 |
Connecticut | On-Demand Loose Transparency | Strict Protections | Strict Ban | Reportable Jurisdiction | 1,700,000 |
Hawaii | Strict Transparency | Strict Protections | Strict Ban | Physical Jurisdiction | 650,000 |
Illinois | Strict Transparency | Strict Protections | Strict Ban | Reportable Jurisdiction | 6,200,000 |
Maryland | Strict Transparency | Strict Protections | Loose Ban | Physical Jurisdiction | 2,800,000 |
Massachusetts | Strict Transparency | Strict Protections | Strict Ban | Reportable Jurisdiction | 3,800,000 |
Minnesota | Strict Transparency | Strict Protections | Strict Ban | Reportable Jurisdiction | 3,000,000 |
Nevada | Automatic Loose Transparency | Loose Protections | Strict Ban | Physical Jurisdiction | 1,500,000 |
New Jersey | Strict Transparency | Strict Protections | Strict Ban | Reportable Jurisdiction | 4,300,000 |
New York | Strict Transparency | Strict Protections | Strict Ban | Full Jurisdiction | 9,800,000 |
Rhode Island | Strict Transparency | Strict Protections | Strict Ban | Physical Jurisdiction | 500,000 |
Vermont | Strict Transparency | Strict Protections | Strict Ban | Reportable Jurisdiction | 300,000 |
Washington | Strict Transparency | Strict Protections | Strict Ban | Full Jurisdiction | 3,700,000 |
District of Columbia | Strict Transparency | Strict Protections | Strict Ban | Full Jurisdiction | 800,000 |
Total: 15. |
The 14 states, plus the District of Columbia, with pay transparency laws currently in effect cover almost 60,000,000 non-farm W-4 workers.
The reality of pay transparency
Approximately half of all workers may be covered by pay transparency laws by the end of 2026 if trends continue.
While the national numbers look encouraging, the reality on the ground isn't always as clear as the top-line numbers might suggest. To find out what pay transparency looks like in practice, we collected data from five representative systems and evaluated it for salary disclosure.
We took a point in time of job listings available on several major job listings websites and compiled them for analysis. The data was collected in late April and May 2025 and primarily covered the period between April 1st, 2025, and May 25th, 2025.
Compliance classification
To evaluate the state of pay transparency, all job listings examined were classified as fully compliant, partially compliant, and noncompliant.
- Full compliance: The posting either provides an exact wage or a range is given. In the case of a range, the difference between the top and bottom must equal no more than 33% of the bottom.
For example, a salary range of $100,000 to $133,000 would be fully compliant. - Partial compliance: A range for potential pay is provided, but the range is so large that it's of little use to prospective candidates.
For example, a salary range of $100,000 to $200,000 would be partially compliant. - Non-compliant: Listings with no salaries or salary ranges included, making them fully non-compliant with pay transparency legislation.
While states with no pay transparency laws have nothing to comply with, we maintained consistent terminology across jurisdictions to make it easier to follow and compare.

Get a quick overview
For a visual summary of the report, see our infographic.
Results: The 2025 Pay Transparency Index
We examined:
- 13,303 job listings across 12 jurisdictions.
- Wages ranging from a minimum of $14,560 to a maximum of $951,000 per year, with a mean annual salary of $104,570 and a median of $85,000.
| n | Min | Max | Mean | Median |
|---|---|---|---|---|---|
All | 13,303 | $14,560 | $951,000 | $104,570 | $85,000 |
New York, NY | 497 | $29,120.00 | $542,000.00 | ¢138,425.69 | $130,000.00 |
Denver, CO | 1,258 | $20,000.00 | $500,000.00 | $90,367.26 | 73,670.00 |
Washington, DC | 1,747 | $20,800.00 | $432,000.00 | $107,231.81 | $90,000.00 |
Chicago, IL | 1,821 | $15,000.00 | $750,000.00 | $126,623.04 | $80,000.00 |
Seattle, WA | 927 | $24,960.00 | $559,520.00 | $104,804.17 | $86,410.00 |
San Francisco, CA | 1,284 | $20,800.00 | $624,000.00 | $131,719.77 | $120,500.00 |
Fresno, CA | 292 | $29,120.00 | $559,520.00 | $90,043.27 | $53,560.00 |
Los Angeles, CA | 1,387 | $20,800.00 | $951,000.00 | $99,702.98 | $80,000.00 |
Stamford, CT | 149 | $20,000.00 | $523,000.00 | $62,607.79 | $84,500.00 |
Boston, MA | 1,051 | $14,560.00 | $559,520.00 | $59,368.89 | $93,600.00 |
Austin, TX | 1,456 | $20,800.00 | $700,000.00 | $103,152.66 | $74,250.00 |
Miami, FL | 1,434 | $14,560.00 | $650,000.00 | $92,864.73 | $65,000.00 |
Pay transparency at a glance
We found that:
- 45% of jobs across our full sample were fully compliant with pay transparency requirements.
- An additional 22% were partially compliant.
However, it's important to note that this figure is on the higher end due to having a larger sample of jurisdictions with mandated pay transparency:
- ~69% of listings from strict transparency jurisdictions.
- ~9% from partial transparency jurisdictions.
- ~22% from jurisdictions with no transparency mandates.
Looking at the numbers on a jurisdiction-by-jurisdiction basis paints a different picture. There's a stark divide between places where wages have to be posted and those where determining whether to post wages is left to the employer's discretion.
| Full Comp # | Full Comp % | Part Comp # | Part Comp % | Noncomp # | Noncomp % |
|---|---|---|---|---|---|---|
All | 6,269 | 45% | 3,094 | 22% | 4,437 | 32% |
Fresno, CA | 194 | 66% | 33 | 11% | 65 | 22% |
Seattle, WA | 515 | 56% | 257 | 28% | 155 | 17% |
Denver, CO | 701 | 56% | 321 | 26% | 236 | 19% |
Los Angeles, CA | 759 | 55% | 346 | 25% | 282 | 20% |
New York, NY | 262 | 53% | 128 | 26% | 107 | 22% |
San Francisco, CA | 673 | 52% | 376 | 29% | 235 | 18% |
Chicago, IL | 883 | 49% | 438 | 24% | 500 | 28% |
Washington, DC | 806 | 46% | 373 | 21% | 568 | 33% |
Stamford, CT | 62 | 42% | 33 | 22% | 54 | 36% |
Boston, MA | 346 | 33% | 223 | 21% | 482 | 46% |
Austin, TX | 410 | 28% | 230 | 16% | 816 | 56% |
Miami, FL | 396 | 28% | 208 | 15% | 830 | 58% |
Full Pay Transparency Laws | 4,793 | 54% | 2,272 | 24% | 2,148 | 22% |
Partial Pay Transparency Laws | 408 | 37% | 256 | 22% | 536 | 41% |
No Pay Transparency Laws | 806 | 28% | 438 | 15% | 1,646 | 57% |
The pay transparency divide
Overall, jurisdictions with pay transparency laws did much better than those without. Over 75% of jobs posted in pay transparency jurisdictions included a salary range — 1.8 times more than listings in areas without pay transparency laws.
This was higher than expected. Aside from a brief dip at the beginning of the COVID-19 pandemic, the U.S. has been at or above full employment since about 2014 (unemployment rate below 6%). That would suggest a strong labor market. We hypothesized that this would encourage employers to adopt pay transparency to attract workers, but that hasn't happened.
Skirting the law
One of the biggest surprises was looking at pay transparency in locations where it's mandated by law. Only about half of all job listings in New York, Denver, and the District of Columbia met our criteria for full compliance. Almost a quarter of all job listings in these cities did not include any wage information.
Even in jurisdictions with mandatory compliance, we found a 20-point (44%) gap between the highest and lowest full compliance rates. Washington, D.C., had the lowest compliance rate at about 46%, while Fresno had the highest.
| Full Comp % | Part Comp % | Noncomp % | Full Comp Δ from Mean | Months in effect |
|---|---|---|---|---|---|
Fresno, CA | 66% | 11% | 22% | +27% | 28 |
Denver, CO | 56% | 26% | 19% | +6% | 52 |
Seattle, WA | 56% | 28% | 17% | +6% | 28 |
Los Angeles, CA | 55% | 25% | 20% | +4% | 28 |
New York, NY | 53% | 26% | 22% | +1% | 20 |
San Francisco, CA | 52% | 29% | 18% | +0% | 28 |
Chicago, IL | 49% | 24% | 28% | -8% | 4 |
Washington, DC | 46% | 21% | 33% | -12% | 11 |
(Outliers highlighted in bold for visibility.)
There are some clear patterns, however:
- It takes time for compliance to take effect. Jurisdictions with older compliance legislation tended to have the highest compliance rates.
- The bulk of pay transparency gains come quickly — jurisdictions that pass pay transparency laws see strong gains of about 5% improved compliance per month (over the mean for jurisdictions with no transparency laws) in the first six months.
- After the first six months, compliance gains begin to decrease rapidly, although steady monthly gains persist even after a year or two.
- Full compliance tends to top out at around 55%, regardless of how long pay transparency laws have been in effect.
Overall, about a quarter of all job postings in mandatory pay transparency jurisdictions lacked salary information. This number drops to an approximately 20% noncompliance rate if the two newest strict transparency jurisdictions are removed but remains relatively intransigent after that.
Politics is less important than policy
Despite Connecticut and Massachusetts having strong labor rights histories, they significantly lag behind other jurisdictions in pay transparency compliance. This shows that historical and political contexts don't predict actual adherence.
For example, New York job listings are over 25% more compliant than those in neighboring, more progressive Stamford. Politics may influence whether laws pass but not how well they're followed.
Workers who need transparency the most benefit the least
The finding that surprised us the most was the relationship between wages listed in job postings and overall wages.
Across every jurisdiction, the median annual wages for listings with an included pay range were:
- 1.4 times higher on average than the local median individual income.
- Almost three times higher than the current local minimum wage.
On an individual basis, this ranged from a low of 1.09 times the median (2.2 times the minimum) for Los Angeles to 1.6 times the median (2.4 times the minimum) in Chicago.
| Median Listing Wage Per Year | Official Median Individual Income | Local Minimum Wage Per Year |
|---|---|---|---|
New York, NY | $130,000 | $81,759 | $34,320 |
San Francisco, CA | $120,500 | $104,400 | $39,894 |
Boston, MA | $93,600 | $61,919 | $31,200 |
Washington, DC | $90,000 | $75,714 | $36,400 |
Seattle, WA | $86,410 | $68,941 | $43,181 |
Stamford, CT | $84,500 | $66,949 | $32,635 |
Los Angeles, CA | $80,000 | $72,384 | $37,170 |
Chicago, IL | $80,000 | $48,954 | $33,696 |
Austin, TX | $74,250 | $48,006 | $15,080 |
Denver, CO | $73,670 | $62,503 | $39,125 |
Miami, FL | $65,000 | $49,105 | $24,960 |
Fresno, CA | $53,560 | $33,875 | $34,320 |
While delays in official median wage reporting partially explain the gap (most jurisdictions only had data available as of Q1 2024), the consistency across jurisdictions and lack of minimum-wage and low-wage positions in the data suggest that higher earners disproportionately benefit from pay transparency laws.
This is likely due to several causes:
- Many pay transparency laws have a minimum employee threshold that must be reached, excluding smaller employers from the requirement to list wages. Smaller employers tend to offer lower salaries, which might skew the data.
- Smaller employers that are not excluded, or those that tend to hire lower-wage workers, may not be as aware of the requirements under these laws, which can lead them to stray from compliance.
- There is significant research that suggests employers of low-wage workers feel more comfortable breaking the law or exploiting their workforce for personal gain. Low-wage workers might be more scared to report violators, may not understand the protections they're legally entitled to, or may be alienated or disenfranchised from the legal system.
Regardless of the cause, our research makes one thing clear: pay transparency legislation is not helping the people who need it the most.
Want to dive into all the details?
For more insights and a deeper understanding of the methodology we used, read our full report.
Frustration for employees, frustration for employers
Our analysis shows several issues with the implementation of pay transparency laws. These problems don't just hurt workers; they also harm employers, making life difficult for HR professionals — especially CHROs at companies hiring across multiple jurisdictions.
Some of the biggest problems include:
Jurisdictional mosaic
Because these laws are implemented at the state, county, and city levels, the result has been a jigsaw puzzle of conflicting regulations and rules. Large enterprises are left with the decision to either standardize job listings or bring on HR staff who are experts within their jurisdictions.
Both strategies have their flaws:
- Standardizing job listings could give competitors the information they need to offer higher salaries to poach top talent or lower ones to undercut on labor costs.
- Localizing HR can consume a lot of time and resources.
Inconsistent enforcement and poor enforcement mechanisms
Employers who go out of their way to follow the full letter of the law might grow frustrated as they see competitors violate pay transparency laws without consequences.
This often happens because:
- Almost all U.S. pay transparency laws require complaints from workers to trigger an investigation. Even with complaints, investigations aren't guaranteed, and fines and penalties aren't consistently assessed or enforced.
- Even when fines are assessed, non-compliance with pay transparency laws may ultimately prove to be cheaper than the benefits unscrupulous companies stand to gain.
Vague definitions and poor communication
Pay transparency laws that require "good faith" salary ranges leave busy HR professionals in the unenviable position of having to make judgment calls that can have expensive repercussions for their companies.
They may have to:
- Figure out whether laws apply only to in-state employees or remote workers as well.
- Determine whether someone from a covered state can apply at all without triggering penalties.
- Investigate the often haphazard approaches states have taken to communicating laws, including when they take effect and what kind of phase-in period (if any) may be in place.
In short, HR professionals who strive to remain compliant often find themselves acting as detectives, lawyers, judges, and interpreters.
Where the U.S. needs to go
The U.S. needs a unified national pay transparency framework that simplifies compliance for companies. But passing a uniform code for states to use requires HR professionals, organizations, CHROs, and other stakeholders to come together and craft a framework that's at least as comprehensive as the legislation in New York, California, Colorado, and others.
So by way of conclusion, we offer a challenge to HR leaders: rather than fight pay transparency, take the lead. HR professionals and organizations can pave the way toward a unified standard for pay transparency — one that streamlines job listing requirements for companies, improves the experience for job seekers, and ultimately leads to better outcomes for all.
For more insights, read our full report.
In the meantime, HR professionals struggling to navigate the increasingly complex world of pay transparency legislation can contact beqom to find out how we can help you make sense of the pay transparency jigsaw puzzle.


